Citation: L'Heureux, M.L., S. Lee, and B. Lyon, 2013: Recent multidecadal strengthening of the Walker circulation across the tropical Pacific. Nature Clim Change, doi: 10.1038/nclimate1840.
Ten different datasets from reanalyses, reconstructions, and in situ measurements are examined for sea level pressure (SLP) trends over the tropical Pacific. Instead of fitting a single least squares linear trend through the entire 1900-2011 record, running linear trends are calculated every six months over varying length windows (10-, 20-, 30-, and 40-year). For the 20-40 year windows over Indonesia (110-160E, 10S-10N), a gradual increase from negative to positive SLP trends is evident beginning in 1910-1920 (see top figure below). Then, starting in 1955-1965, the the positive trends cease growing and eventually trends become significantly negative over the last several decades. In contrast, over the Eastern Pacific (130-80W, 10S-10N), trends are less significant but there is evidence for a tendency towards positive SLP trends starting in the late 1950s or 1960s (see bottom figure below). The tendency towards lower SLP over Indonesia and higher SLP over the eastern Pacific suggests a strengthening Walker circulation over the last half of the 20th century. This increase in the Walker circulation becomes even more apparent when ENSO variability (using the Nino-3.4 index) is linearly removed from the datasets. Moreover, the tendency for a strengthening Walker circulation appears to be nearly concurrent with the shift toward positive trends in global average temperatures.
While not shown below (see supplementary info), we note that a significant lack of in situ SLP data (ICOADS.v2.5) over the tropical Pacific is linked to larger disagreement in the datasets during the first half of the 20th century. Therefore, caution is recommended when interpreting the observed linear SLP trends prior to the 1950s.
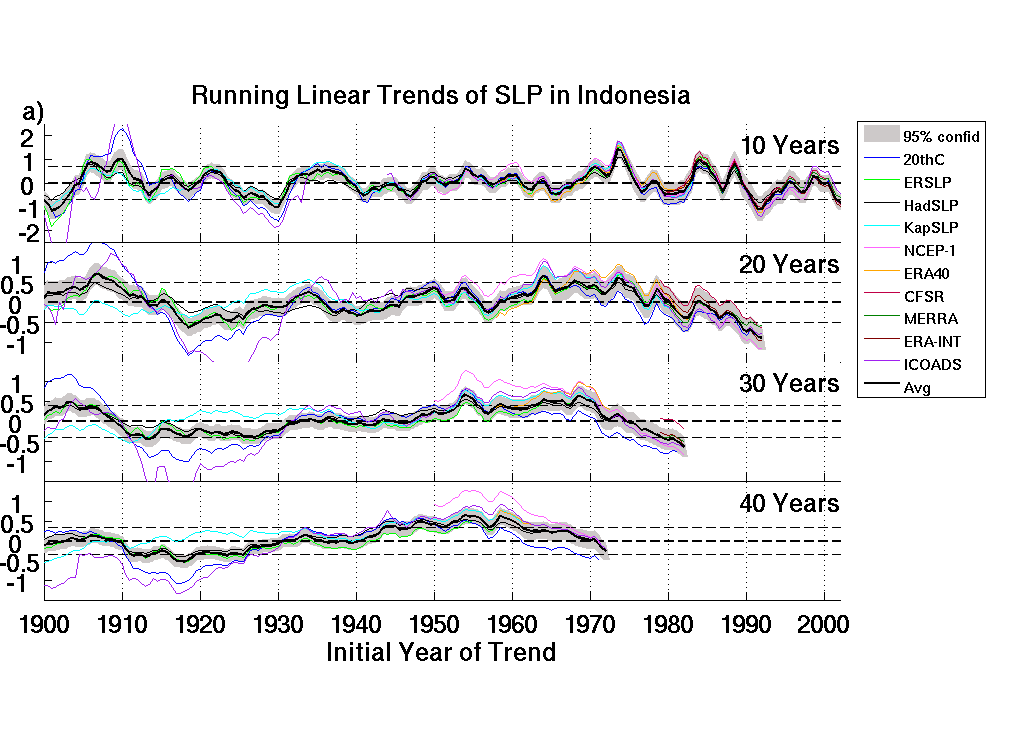
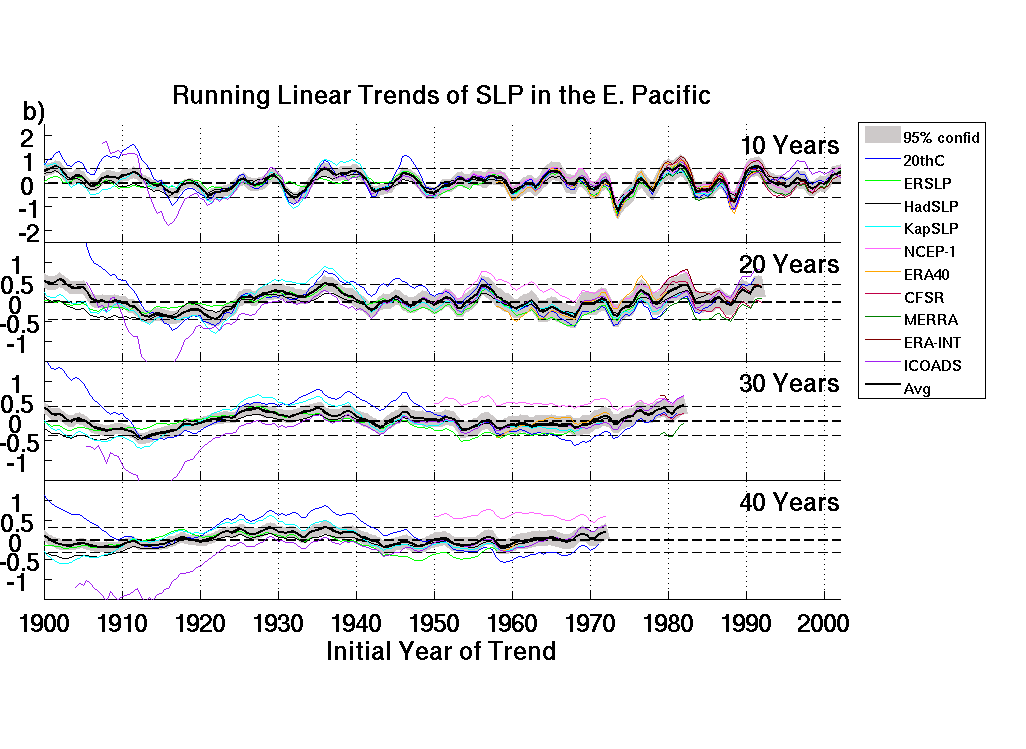
SLP linear trends for 10-, 20-, 30-, 40-year moving windows from January 1900 to December 2011. (TOP FIGURE) Trends for the region over Indonesia (110◦–160◦ E, 10◦ S–10◦ N) and (BOTTOM FIGURE) for the region over the eastern Pacific Ocean (130◦–80◦ W, 10◦ S–10◦ N) . SLP is expressed as the change (hPa) over the window length. Grey shading represents the 95% confidence level based on a two-tailed Student’s t-test. The dashed, horizontal lines represent the 95% range of trends based on 1,000 synthetic AR(1) time series. The x axis shows the initial year of the trend (for 10-year windows, 1950 denotes the 1950–1959 trend).